
Savana 2500 V8-6.6L DSL Turbo VIN 6 (2007)
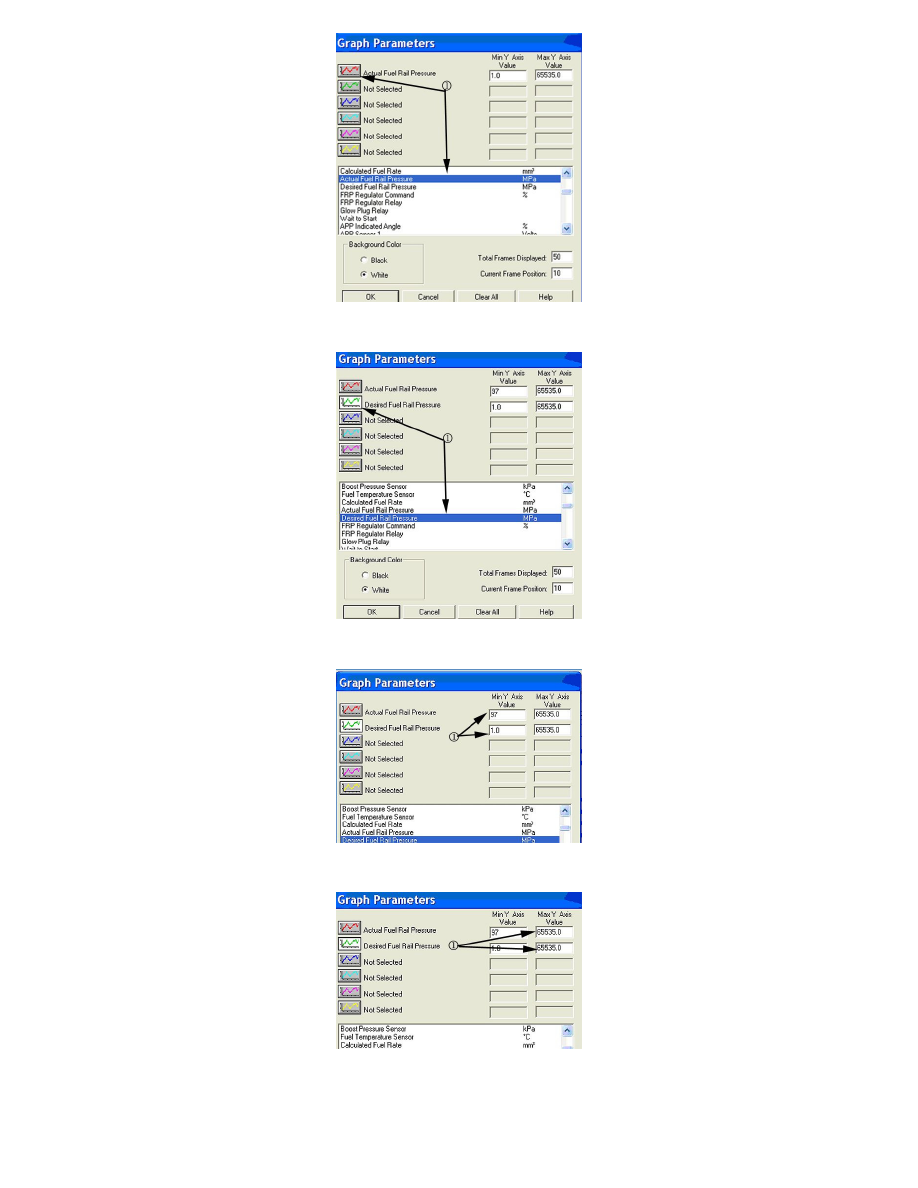
2. Graph Parameters, first select "Actual Fuel Rail Pressure" from the bottom data file this will become the top red line graph value (1).
3. Select the next green line graph (1) and then click on the "Desired Fuel Rail Pressure" from the bottom data file.
4. Change the first two Min Y Axis Values (1) from 1.0 to 97.
5. Change the second two Max Y Axis Values (1) from 65535.0 to 103.
6. Click OK to display graph.
7. Copy the graph by pushing down on the Control (Ctrl) and Print Screen (Print Scrn) buttons at the same time on your computer key board.
8. Open MS Paint and paste the line graph into Paint using the directions below: