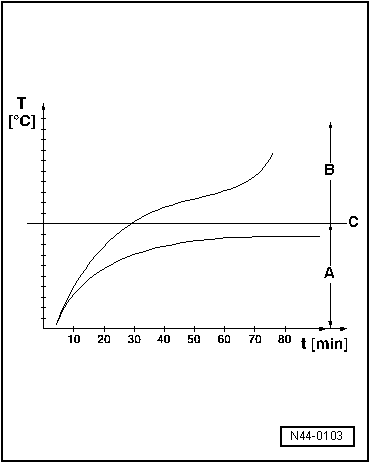
| The graph shows the temperature changes for a tyre in operation at a speed of 180 km/h. |
| A - | Normal range. When the specified tyre pressure is adhered to, the temperature will remain stable. |
| B - | Danger zone. When tyre pressure is 0.3 bar below specification, the temperature rises to above 120° C at high speeds. |
| C - | Critical temperature threshold. A tyre defect will develop. |
| t - | Travel time in minutes |
|
|
|