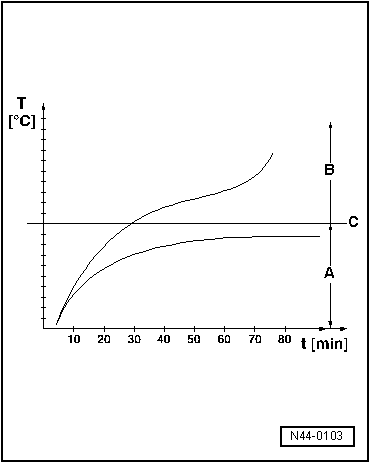
| The diagram shows the evolution of the temperature of a tyre at a speed of 180 km/h. |
| A - | Normal range: the temperature remains stable while the specified tyre pressure is maintained. |
| B - | Limit range: A decrease in the nominal inflation pressure of 0.3 bars results in an increase in the temperature when driving at high speeds to over 120 °C. |
| C - | Critical temperature limit: tyre failure is now programmable. |
| t - | Travelling time in minutes. |
|
|
|